Evidence Hub analytics
Suggestion: move into this part around mid-March, once you and others have had the chance to do some work in the Hub — the analytics will then make more sense…
![]()
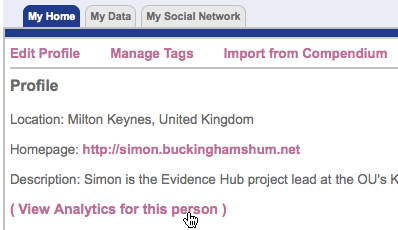
As we mentioned right at the start, on your homepage are your personal analytics and user log.
Some summary statistics are displayed on your homepage, but the more detailed analytics are generated on request on clicking the link (since these may take some time to retrieve) — example:
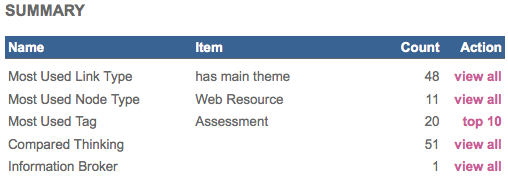
In the summary table, Most Used Node Type (Issue; Solution; Web Resource, etc) and Tag are self-explanatory, but a few merit further comment:
Analytics based on making meaningful connections between ideas
Link Types. Every new contribution you make to a Hub is in fact forging new connections behind the scenes. It’s not always useful to show these as connections per se (risk of spaghetti/hairball diagrams), but we do render filtered views in the self-organising network visualization (the Java applet), and more are revealed in the analytics. This summary table shows that as I started to populate the Hub, I was mainly indexing content against Themes (which behind the scenes was creating has main theme links).
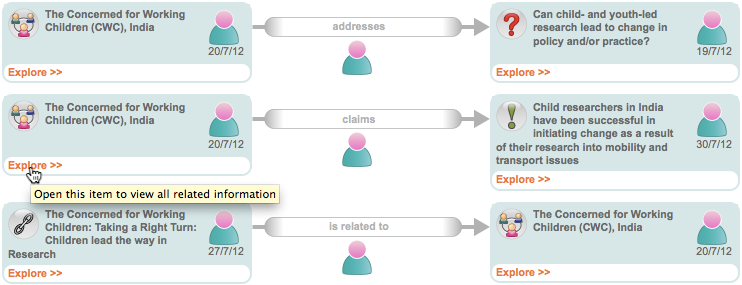
Compared Thinking. This analytic is a proxy for the degree to which I connect my ideas — either my own, or those of others. These are rendered as follows, enabling the user, a peer, or a teacher/mentor to see the kinds of connections being made, and to jump into the more detailed context of those moves, if desired:
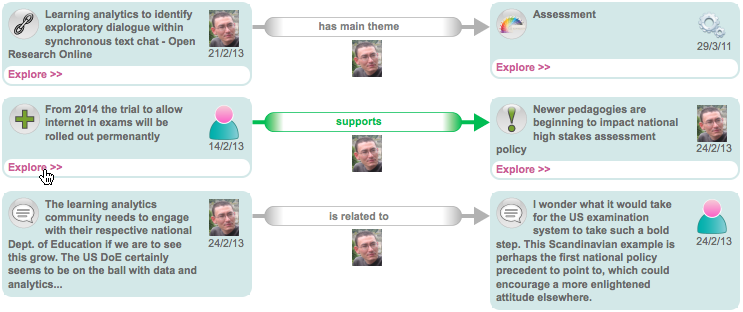
Note: is related to is the weakest form of link, created when I replied to a Chat thread.
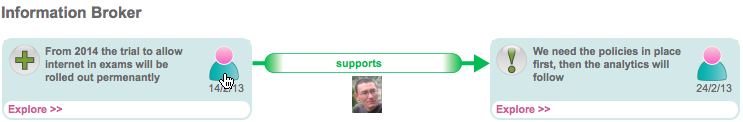
Information Broker. This measure shows the extent to which I am able to forge meaningful new connections between the contributions of my peers. Arguably this is a more advanced kind of competence than connecting my own ideas (but this is a good discussion to have from a pedagogical perspective).
User activity trace
On the user’s homepage there is also a summary of the user’s core activity in terms of the types of content created:
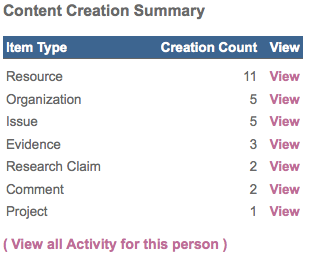
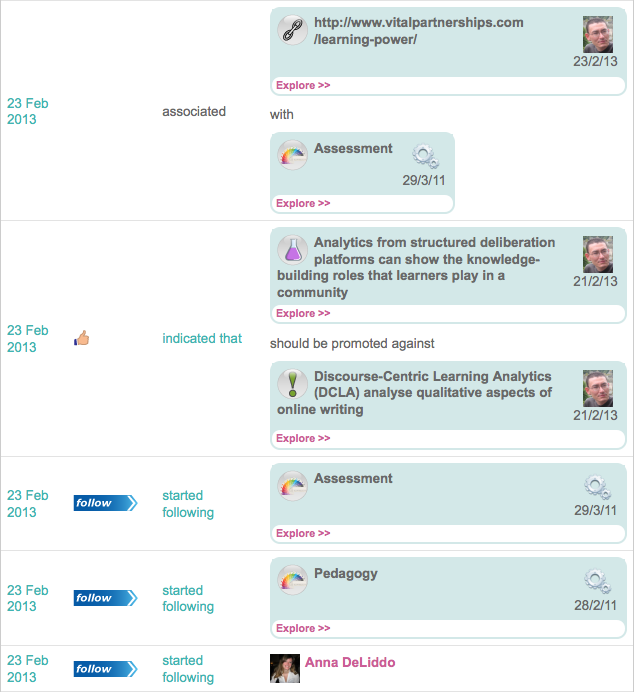
Following link provides an event-level breakdown of user actions [example]
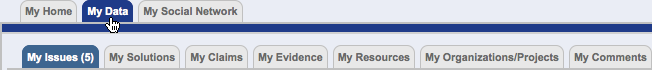
Under the My Data tab you find a set of sub-tabs where you can see all of your contributions by category.
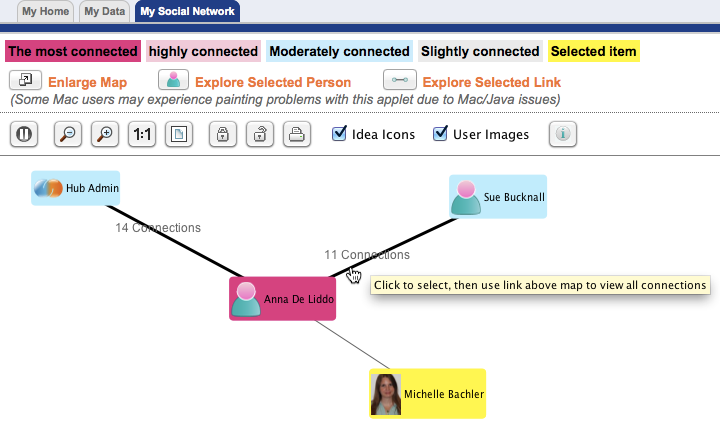
Finally, My Social Network shows who you have tied to for some reason. Where there are multiple ties with someone, Explore Selected Link expands shows the contexts in which you are tied. While you might be tied because you are directly commenting on a peer or following them, in the Evidence Hub you are as likely, if not more likely, to be tied because you have engaged with their ideas by connecting them to your own or others’ contributions:
Summary
As described in a research paper, we are interested in analytics that help reveal the epistemic roles that people play in a learning community. The examples shown above are first cuts at making available user actions that are not normally possible to extract from conventional forums or collaborative platforms such as blogs and wikis. However, these are very much work-in-progress, and you are invited to reflect on and critique these, once you have immersed yourself in the system this week.
| Activity:
Go to your homepage and explore your analytics and activity report. What, if anything, do they tell you? |
Finally, perhaps a week out from the 1 April close, move to Part 5…